Data Science & AnalyticsPower BI · Business intelligence
Retail Sales Analysis
A self-directed Power BI project: turning a sample retail dataset into a report a manager could move through, from overview to store-level detail.
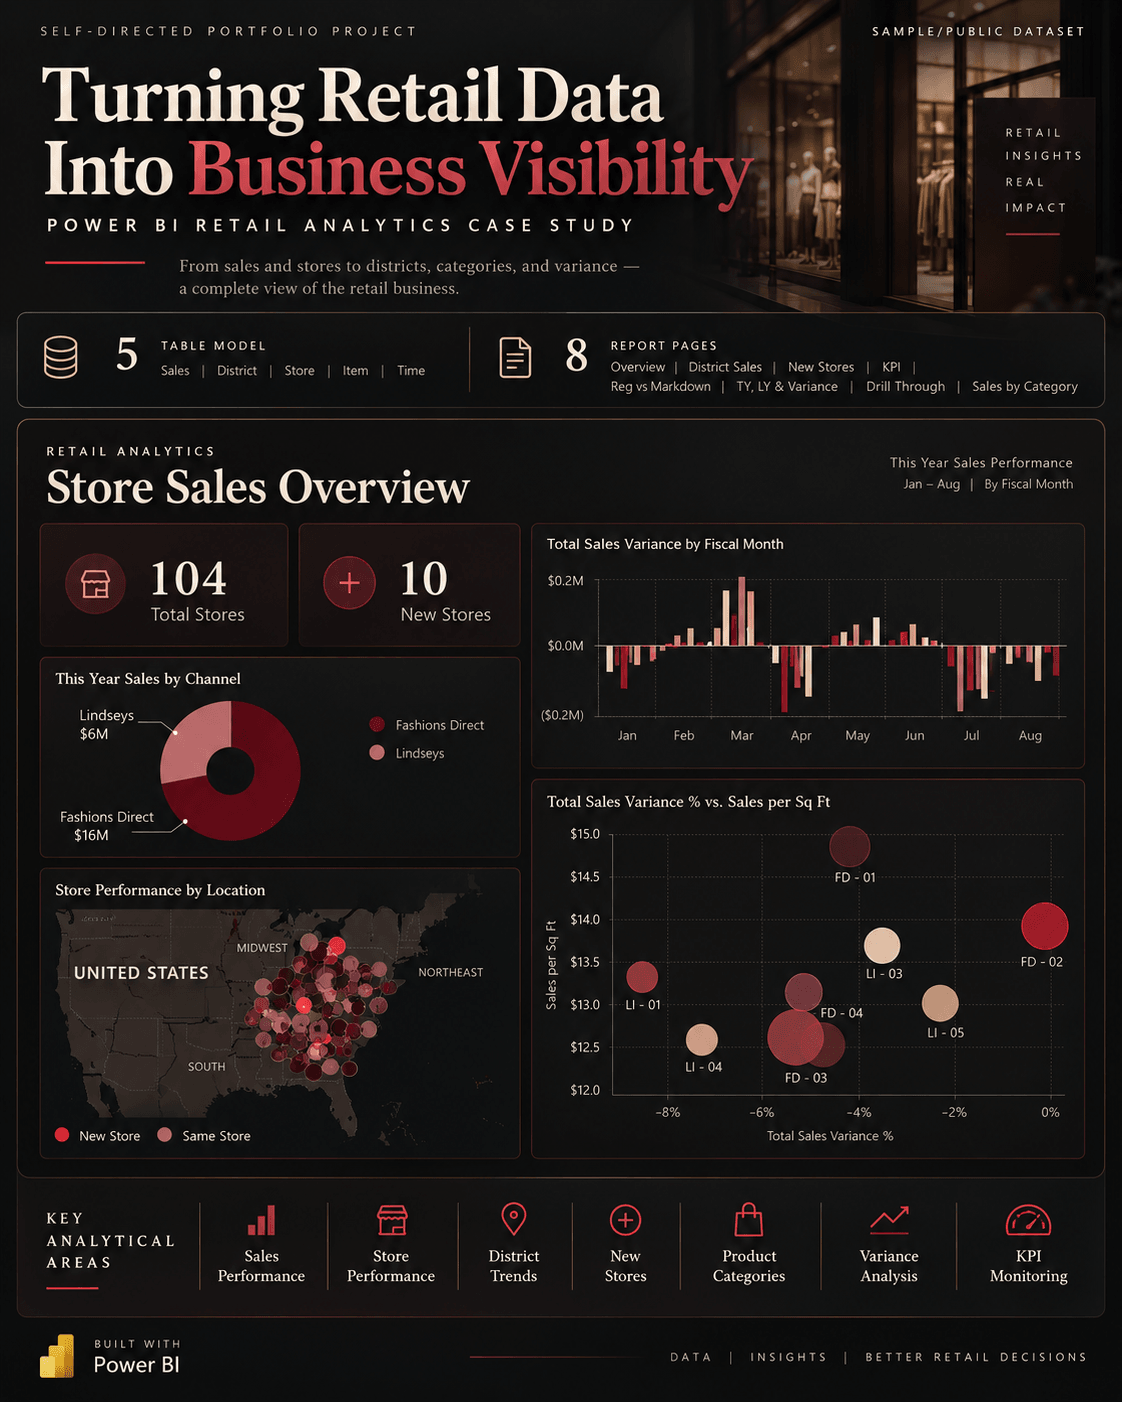
- Role
- End-to-end build: data model, DAX measures, report design and page structure.
- Type
- Self-directed portfolio project
- Status
- Completed · sample dataset
- Tools
- Power BI · DAX · Star schema
- Dataset
- Sample / demo
- Data model
- 5 tables
- Report
- 8 analytical pages
- Project type
- Self-directed
Case study
01Brief
Built for decision support
The goal was a report structured around the questions a retail manager asks (how sales are trending, which stores and districts need attention, how this year compares with last) rather than a single page of every available chart.
02Model
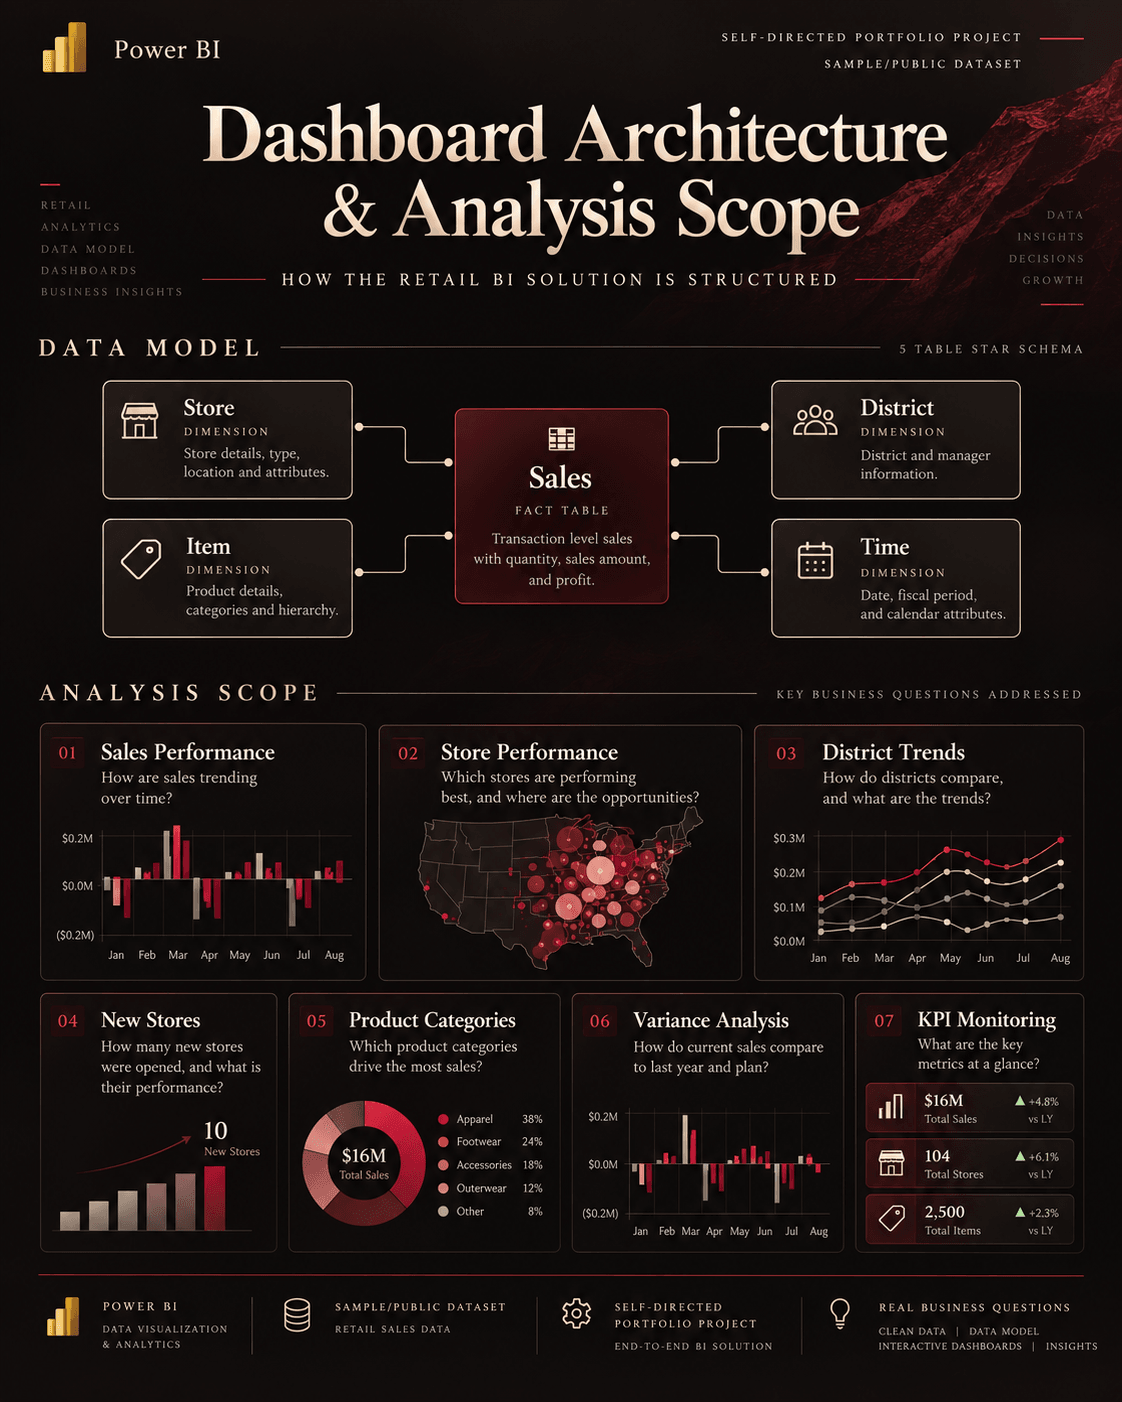
A five-table star schema
A Sales fact table connected to District, Item, Store and Time dimensions, with DAX measures for this-year, last-year and variance calculations.
03Geography
Store and regional segmentation
Map and scatter views segment performance by store, district and region, separating new stores from existing ones and comparing sales per square foot against variance.
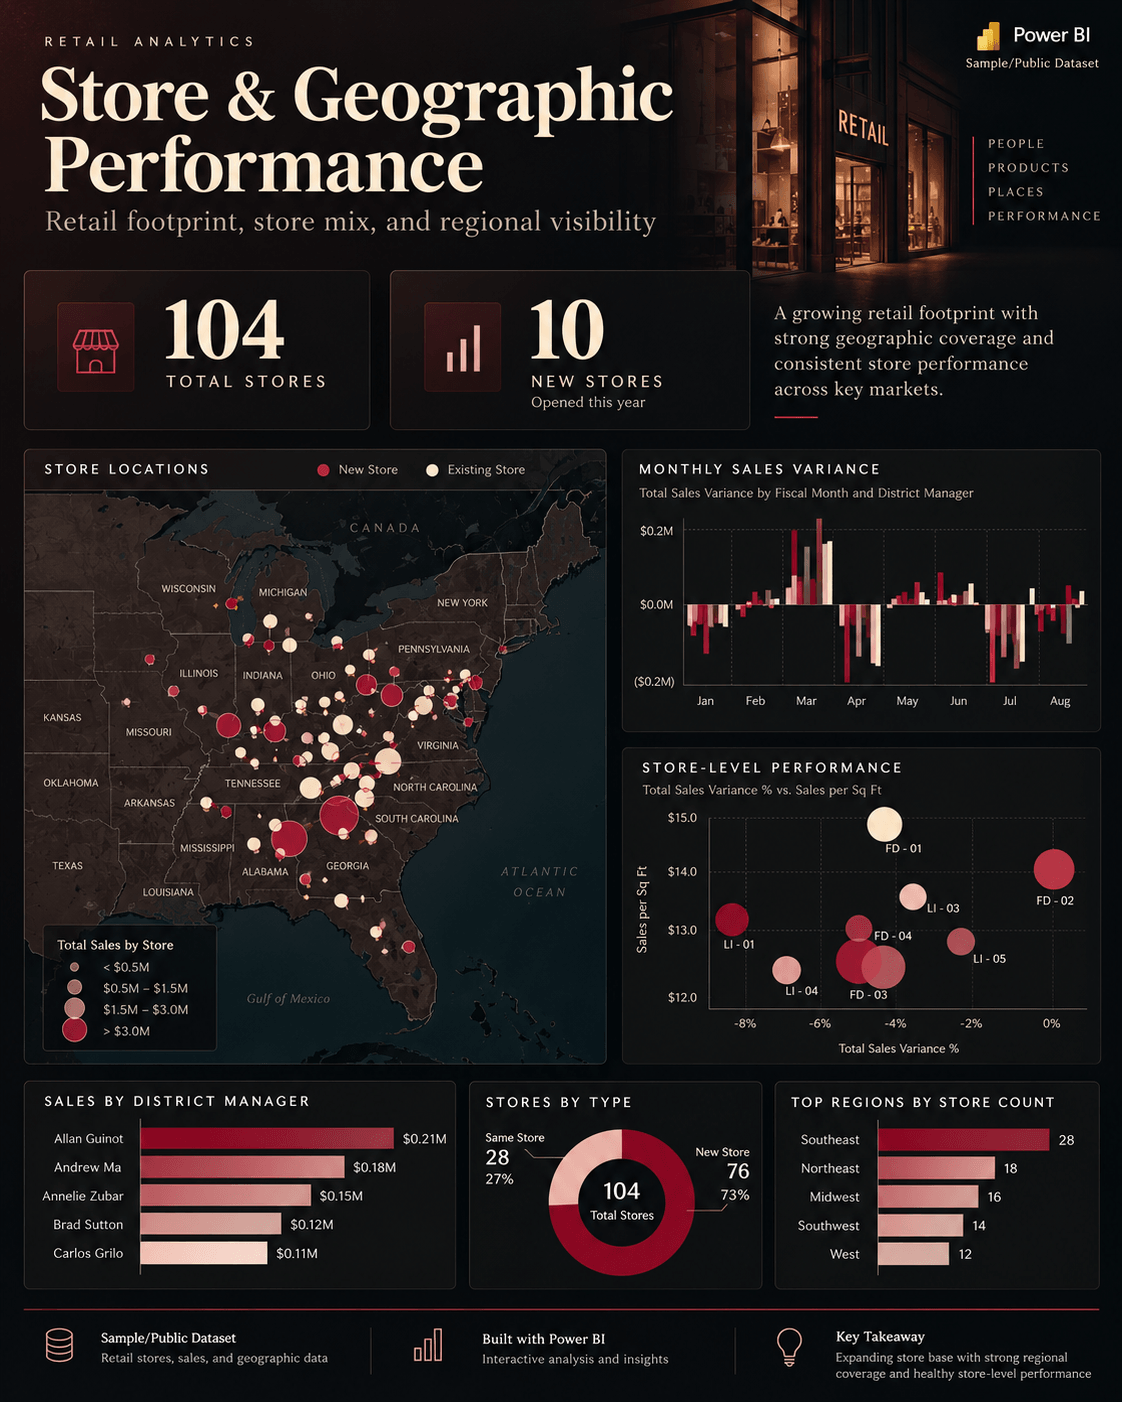
View full size: Store and geographic performance (opens in a new tab)
04Variance
This year against last year
Variance is broken down by fiscal month, district manager and category, with regular and markdown sales separated.
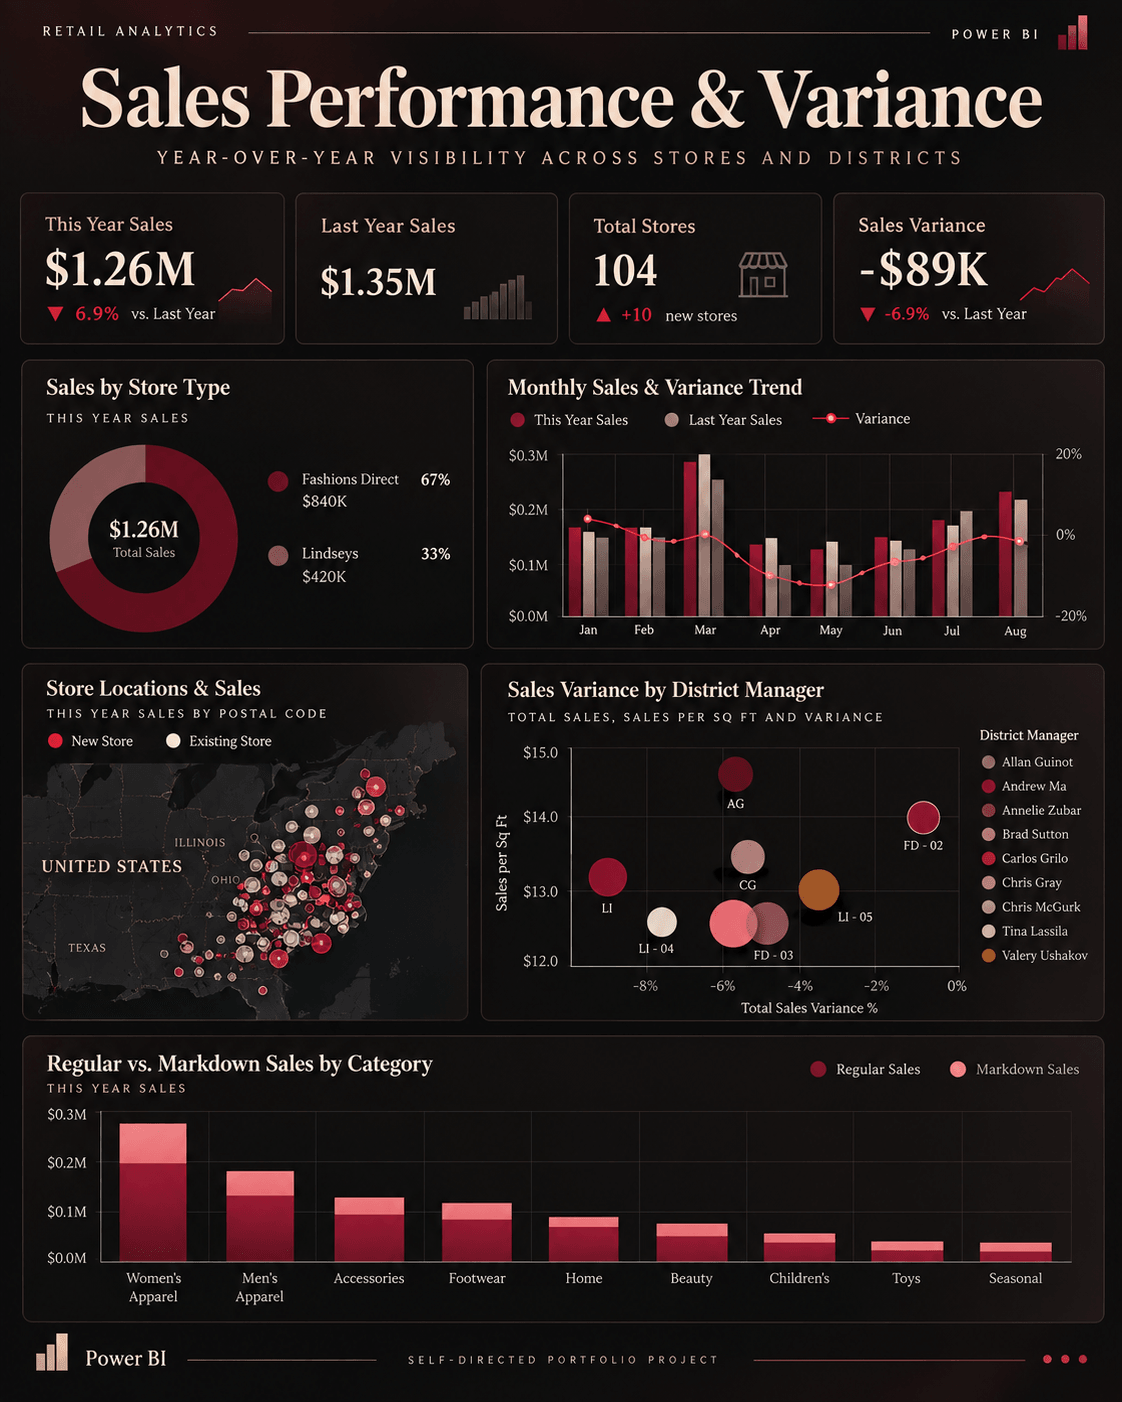
View full size: Sales variance analysis (opens in a new tab)
05Report structure
Eight pages, one path through the data
- Overview
- District monthly sales
- New stores
- KPI
- Regular vs markdown
- This year / last year / variance
- Drill-through
- Sales by category